C4 Component Diagram
Explanation
Section titled “Explanation”A component diagram is the third level of the C4 model (see the article C4 Model). It zooms into one container. A container is a part of the system shown on the Container Diagram (C4 Level 2). The component diagram decomposes that container into the components that live inside it.
Each component comes with its responsibilities and technology details. A reader can see what each part does and what it is built with.
The diagram also shows its surroundings. These supporting elements are:
- the other containers of the system in scope,
- people who connect directly to the components,
- software systems that connect directly to the components.
Create it only when it helps. The C4 guidance says to draw component diagrams only if you feel they add value. Many containers do not need one.
Automate for long-lived documentation. If the documentation must last, consider generating these diagrams instead of drawing them by hand.
Link to arc42. The arc42 building block view has a level 2. It zooms into some of the level 1 building blocks. It favors relevance over completeness. A component diagram can serve that purpose. Pick the containers that matter and skip the rest.
Example
Section titled “Example”An online shop has a container called “Order Service”. Its component diagram shows three components: one that accepts orders, one that calculates prices, and one that talks to the payment provider. Arrows connect them. Outside the box sit the “Web Shop” container, the “Order Database” container, and the external payment system. The “Customer Service” container has no component diagram, because the team saw no gain.
Trade-offs
Section titled “Trade-offs”A component diagram gives readers detail about one container. It also costs effort to make and to keep current. Because of this cost, draw it only where it adds value. For documentation that must last, automating its creation is advised.
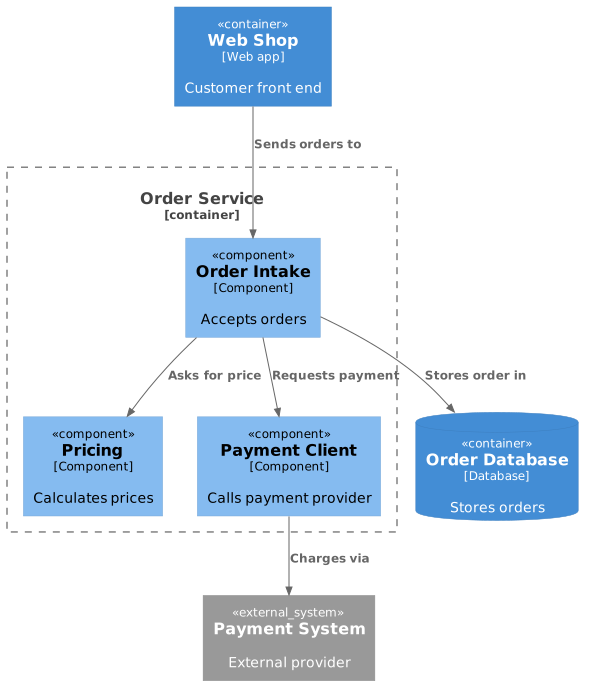
Diagram source
@startuml!include <C4/C4_Component>Container(web, "Web Shop", "Web app", "Customer front end")Container_Boundary(os, "Order Service") { Component(api, "Order Intake", "Component", "Accepts orders") Component(price, "Pricing", "Component", "Calculates prices") Component(pay, "Payment Client", "Component", "Calls payment provider")}ContainerDb(db, "Order Database", "Database", "Stores orders")System_Ext(ps, "Payment System", "External provider")Rel(web, api, "Sends orders to")Rel(api, price, "Asks for price")Rel(api, pay, "Requests payment")Rel(api, db, "Stores order in")Rel(pay, ps, "Charges via")@endumlChecks
Section titled “Checks”- Each component diagram zooms into exactly one container and shows the components inside it with their responsibilities and technology.
- The diagram shows the directly connected containers, people, and software systems around the components.
- Component diagrams exist only for containers where they add value.
- For long-lived documentation, the team has considered automating diagram creation.
Related
Section titled “Related”- C4 Model
- Container Diagram (C4 Level 2)
- C4 Level 4: Code Diagram
- System Context Diagram
- UML Component Diagram
- Diagrams as Code
- Documentation as Code
Sources
Section titled “Sources”- Component diagram | C4 model — c4model.com, accessed 2026-11-09
- 5 - Building block view | arc42 Documentation — docs.arc42.org, accessed 2026-11-09