Application Lifecycle Diagram
Explanation
Section titled “Explanation”An application lifecycle diagram is a Gantt chart. A Gantt chart draws each item as a horizontal bar on a shared timeline. Here, each bar is one application. Alfabet calls its version an application roadmap. It shows the lifecycles of all applications in the repository on one timeline.
What the bars show
The chart shows when each application is planned to go live. It also shows when the application will stop supporting the business.
In Alfabet, a green bar covers the active period, from start date to end date. This gives a labeled planned end date. If a lifecycle is defined, a multi-colored bar sits above the green one. It shows the phases: Plan, Pilot, Production, Sunset and Retired.
What decisions it supports
The chart helps with retirement and replacement decisions. Look for applications that are close to end of life but have no successor planned. Those are gaps to fix.
Link to the TIME model
The TIME model puts each application into one of four categories: tolerate, invest, migrate or eliminate. High technical fit and high functional fit means invest. Low on both means eliminate, so those applications are retirement candidates.
Who owns it
Berrisford treats the application life cycle as a task for the enterprise architecture team. It is separate from the software development life cycle. He also notes that road maps of different types cut across each other. So lifecycle views and transition plans are distinct but overlap.
Example
Section titled “Example”A company tracks three applications: a billing system, a customer portal and an HR tool. The chart shows one bar for each on a shared yearly axis. The HR tool’s bar ends in two years, and its sunset phase is already visible. No bar for a successor exists. The team sees the gap and starts planning a replacement.
Trade-offs
Section titled “Trade-offs”The facts describe what the chart shows, not how to keep it accurate. A chart is only useful if each application has a start date, an end date and, ideally, a defined lifecycle. Without a defined lifecycle, the phase bar is missing and only the active period appears. The chart also shows timing only. Deciding what to do with an application needs a separate assessment, such as the TIME model.
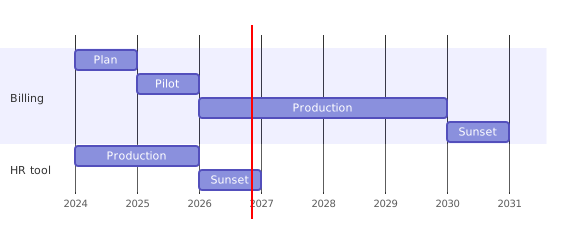
Diagram source
gantt dateFormat YYYY axisFormat %Y section Billing Plan :2024, 1y Pilot :2025, 1y Production :2026, 4y Sunset :2030, 1y section HR tool Production :2024, 2y Sunset :2026, 1yChecks
Section titled “Checks”- Each application appears as one bar on a shared timeline with a labeled planned end date.
- Lifecycle phases such as Plan, Pilot, Production, Sunset and Retired are shown where a lifecycle is defined.
- Applications nearing end of life without a planned successor are identified.
- Each application is assigned a TIME category: tolerate, invest, migrate or eliminate.
Related
Section titled “Related”- Enterprise Architecture
- Application Landscape Evolution Drivers
- Technical Debt
- TOGAF
- Entity Life Cycle
- Application Architecture
Sources
Section titled “Sources”- What is our application roadmap? — documentation.alfabet.com, accessed 2026-11-09
- Gartner® TIME Framework For App Rationalization: Tolerate — leanix.net, accessed 2026-11-09
- — grahamberrisford.com, accessed 2026-11-09