UML Structure Diagram
Explanation
Section titled “Explanation”A structure diagram answers one question: what is the system made of? It shows building blocks and their relationships. It does not show how the system acts over time. Behavior diagrams cover that. They show how objects collaborate (see UML Behavioral Diagram).
Three structure diagram types appear in the facts.
Composite structure diagram. It shows the internal structure of a class and the collaborations that structure makes possible. A port is an interaction point. It connects a structured classifier (a class with internal parts) to its parts. See Port.
Component diagram. It shows how a software system is split into components and which dependencies exist between them. See UML Component Diagram.
Deployment diagram. arc42 recommends it for the deployment view, which maps software to hardware. Complex infrastructure can use nested diagrams. Infrastructure matters because software needs hardware. It can influence the system and its cross-cutting concepts. See UML Deployment Diagram.
Link to arc42. The arc42 building block view is a static decomposition of the system. It is mandatory. Level 1 is a white box of the whole system, with black boxes inside. Level 2 zooms into some of those blocks. Level 3 zooms further. Structure diagrams can show each level.
Link to C4. The C4 model is named after a set of static structure diagrams: context, containers, components and code. It was inspired by UML and the 4+1 model. Teams that use UML successfully can keep it. They may add UML state or timing diagrams to C4. See C4 Model.
Example
Section titled “Example”A team documents an online shop. At level 1, one diagram shows the shop as a whole, with boxes inside: catalog, orders and payment. A second diagram zooms into “orders” and shows its parts and their dependencies. A third diagram shows which server runs the shop. None of these diagrams shows the order in which things happen. The team uses a behavior diagram for that.
Trade-offs
Section titled “Trade-offs”Structure diagrams show only the static picture. Readers learn what exists and how it connects, but not what happens at runtime. Teams need behavior diagrams for that. Several diagram types and levels also mean more diagrams to keep consistent. C4 is an alternative for teams that do not use UML already.
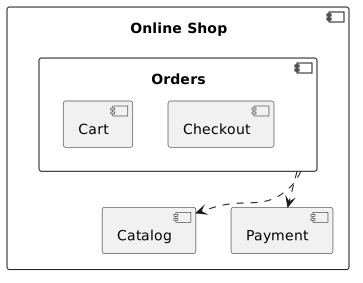
Diagram source
@startumlcomponent "Online Shop" { component Catalog component Orders { component Cart component Checkout } component Payment}Orders ..> CatalogOrders ..> Payment@endumlChecks
Section titled “Checks”- The building block view shows the static decomposition of the system, starting with a level 1 white box containing black boxes.
- Deeper levels zoom into selected building blocks of the level above.
- The deployment view maps software to hardware, with a UML deployment diagram and nested diagrams for complex infrastructure.
- Component diagrams show how the system is split into components and the dependencies between them.
Related
Section titled “Related”- UML 2.5 Diagram Taxonomy
- UML Behavioral Diagram
- UML Component Diagram
- Port
- C4 Model
- Deployment View
- Unified Modeling Language (UML)
Sources
Section titled “Sources”- Unified Modeling Language - Wikipedia — en.wikipedia.org, accessed 2026-11-09
- 5 - Building block view | arc42 Documentation — docs.arc42.org, accessed 2026-11-09
- Composite structure diagram - Wikipedia — en.wikipedia.org, accessed 2026-11-09
- 7 - Deployment view | arc42 Documentation — docs.arc42.org, accessed 2026-11-09
- FAQ | C4 model — c4model.com, accessed 2026-11-09
- Diagrams | C4 model — c4model.com, accessed 2026-11-09