Main Sequence (Balance of Abstractness and Instability)
Explanation
Section titled “Explanation”The main sequence rates a software component, such as a package or assembly, with two numbers.
Instability (I) compares the outgoing dependencies of a component (efferent coupling, Ce) with its total dependencies. The formula is I = Ce / (Ce + Ca), where Ca counts the incoming dependencies. I = 0 means fully stable. I = 1 means fully unstable.
Abstractness (A) is the share of abstract types, meaning abstract classes and interfaces, among the internal types of the component. A = 0 means fully concrete. A = 1 means fully abstract.
Plot I on one axis and A on the other. The ideal components lie on the line A + I = 1. This line is called the main sequence. It balances abstraction and instability.
Distance from the line. Tools measure how far a component sits from the line. NDepend uses the perpendicular, normalized distance. A value of 0 means the component is on the line. A value of 1 means as far as possible. NDepend suggests that values above 0.7 might be problematic.
Two problem zones.
- Zone of pain: both I and A are near 0. These are stable components that are not abstract. The idea behind this zone is that the more stable a package is, the more abstract it should be.
- Zone of uselessness: both I and A are near 1.
The ideal corners are completely abstract and stable (I=0, A=1), or completely concrete and unstable (I=1, A=0).
For related ideas, see the articles Coupling and Cohesion and Component Design Principles.
Example
Section titled “Example”A team plots its components on the chart. One component, “Reports”, has low I and low A, so it sits in the lower-left corner, the zone of pain. A second component has high I and high A, so it sits in the upper-right corner, the zone of uselessness. The team looks first at the components with the largest distance from the line.
Trade-offs
Section titled “Trade-offs”The metric is a guide, not a verdict. Some components in the red zone may be fine.
Counting abstract and concrete types can mislead. One critique says the metric equates abstractness with real abstraction. It can push people to add interfaces only to satisfy the score. Adding empty interfaces games the metric and misses the point.
The logic does hold in some cases. In a collection library, clients depend on an interface such as List, and adding a new implementation is easy.
Reaching the zone of pain takes both low abstractness and high stability. A component that scores high on one and very low on the other need not be there.
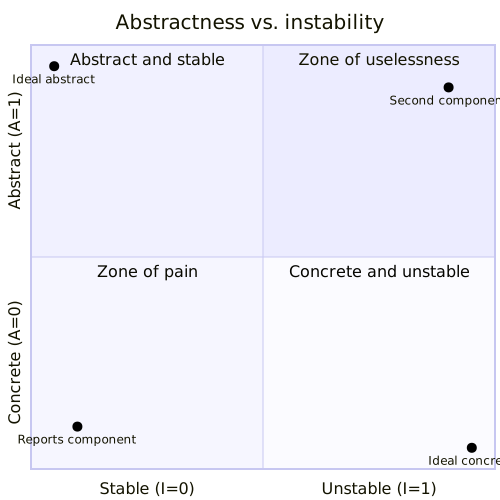
Diagram source
quadrantChart title Abstractness vs. instability x-axis "Stable (I=0)" --> "Unstable (I=1)" y-axis "Concrete (A=0)" --> "Abstract (A=1)" quadrant-1 Zone of uselessness quadrant-2 Abstract and stable quadrant-3 Zone of pain quadrant-4 Concrete and unstable Reports component: [0.1, 0.1] Second component: [0.9, 0.9] Ideal abstract: [0.05, 0.95] Ideal concrete: [0.95, 0.05]Checks
Section titled “Checks”- The document states how instability and abstractness are computed for each component, using the same definitions throughout.
- Components with a high distance from the main sequence are listed, with a stated threshold such as 0.7.
- Components in the zone of pain (low I and low A) are named, and their position is explained or accepted.
- Interfaces added to improve the score have a real purpose and are not empty additions that game the metric.
Related
Section titled “Related”- Coupling and Cohesion
- Component Design Principles
- Architecture Decay
- Technical Debt
- Loose Coupling
- Modularity
Sources
Section titled “Sources”- Code Metrics for C# and .NET: 100+ Definitions — ndepend.com, accessed 2026-11-09
- PHP Depend - Software Metrics for PHP: News — pdepend.org, accessed 2026-11-09
- Software package metrics - Wikipedia — en.wikipedia.org, accessed 2026-11-09
- Oliver Drotbohm - The Instability-Abstractness-Relationship — An Alternative View — odrotbohm.github.io, accessed 2026-11-09
- Entering the Zone of Pain - DaedTech — daedtech.com, accessed 2026-11-09